
Chameleon Software 2026: Sensor Data Visualization
Supplied with every PPS sensor system, Chameleon software is a full-featured, intuitive platform designed to help teams manage, analyse and visualise tactile sensor data in real time.
The redesigned interface is faster, clearer and more flexible, enabling users to uncover smarter answers through improved heat-map rendering, refined 3D defaults, enhanced graph views and powerful new analysis controls. Whether you are conducting research, evaluating industrial processes or developing new products, Chameleon software delivers the tools needed to capture, interpret and export data with confidence.
Visualise tactile data more effectively with an expanded set of display options, including Line Trace, enhanced 2D and 3D heat-maps, mesh plots, and new multi-file comparison views. Recorded data can be explored using upgraded interactive tools, copied directly to the clipboard, and exported through improved single-frame, averaged-second and photo-capture options for seamless use in Excel®, MATLAB®, Python and other third-party environments. With a smoother workflow and more engaging visualisation features, Chameleon 2026 makes it easier than ever to turn complex sensor output into meaningful, actionable insights.
Key Features:

Interface with multiple PPS systems simultaneously, now with smoother device connection and improved performance.
Easy recording, annotating and editing of pressure-mapping data, enhanced with buffer stability and smarter error recovery.
View and control synchronised video alongside your pressure data, now with improved video handling and resolution.
Record and analyse data from multiple sensors synchronised within a single experiment.
Real-time access to average, max, centroid (centre-of-pressure) and contact-area tracking, with advanced options in review mode.
Visualise your sensor data as 2D pseudo-colour maps, 3D bar or mesh graphs of actual shape, or line traces for low-element sensors - now with better defaults and user-saved view configurations.
Export data in ASCII/CSV or directly for use in Excel®, MATLAB®, or Mathcad® (and other workflows), enhanced with new frame-export, photo capture and multi-file comparison tools.
Windows API available for custom software integration and automation.
센서 맵핑(Sensor Mapping)
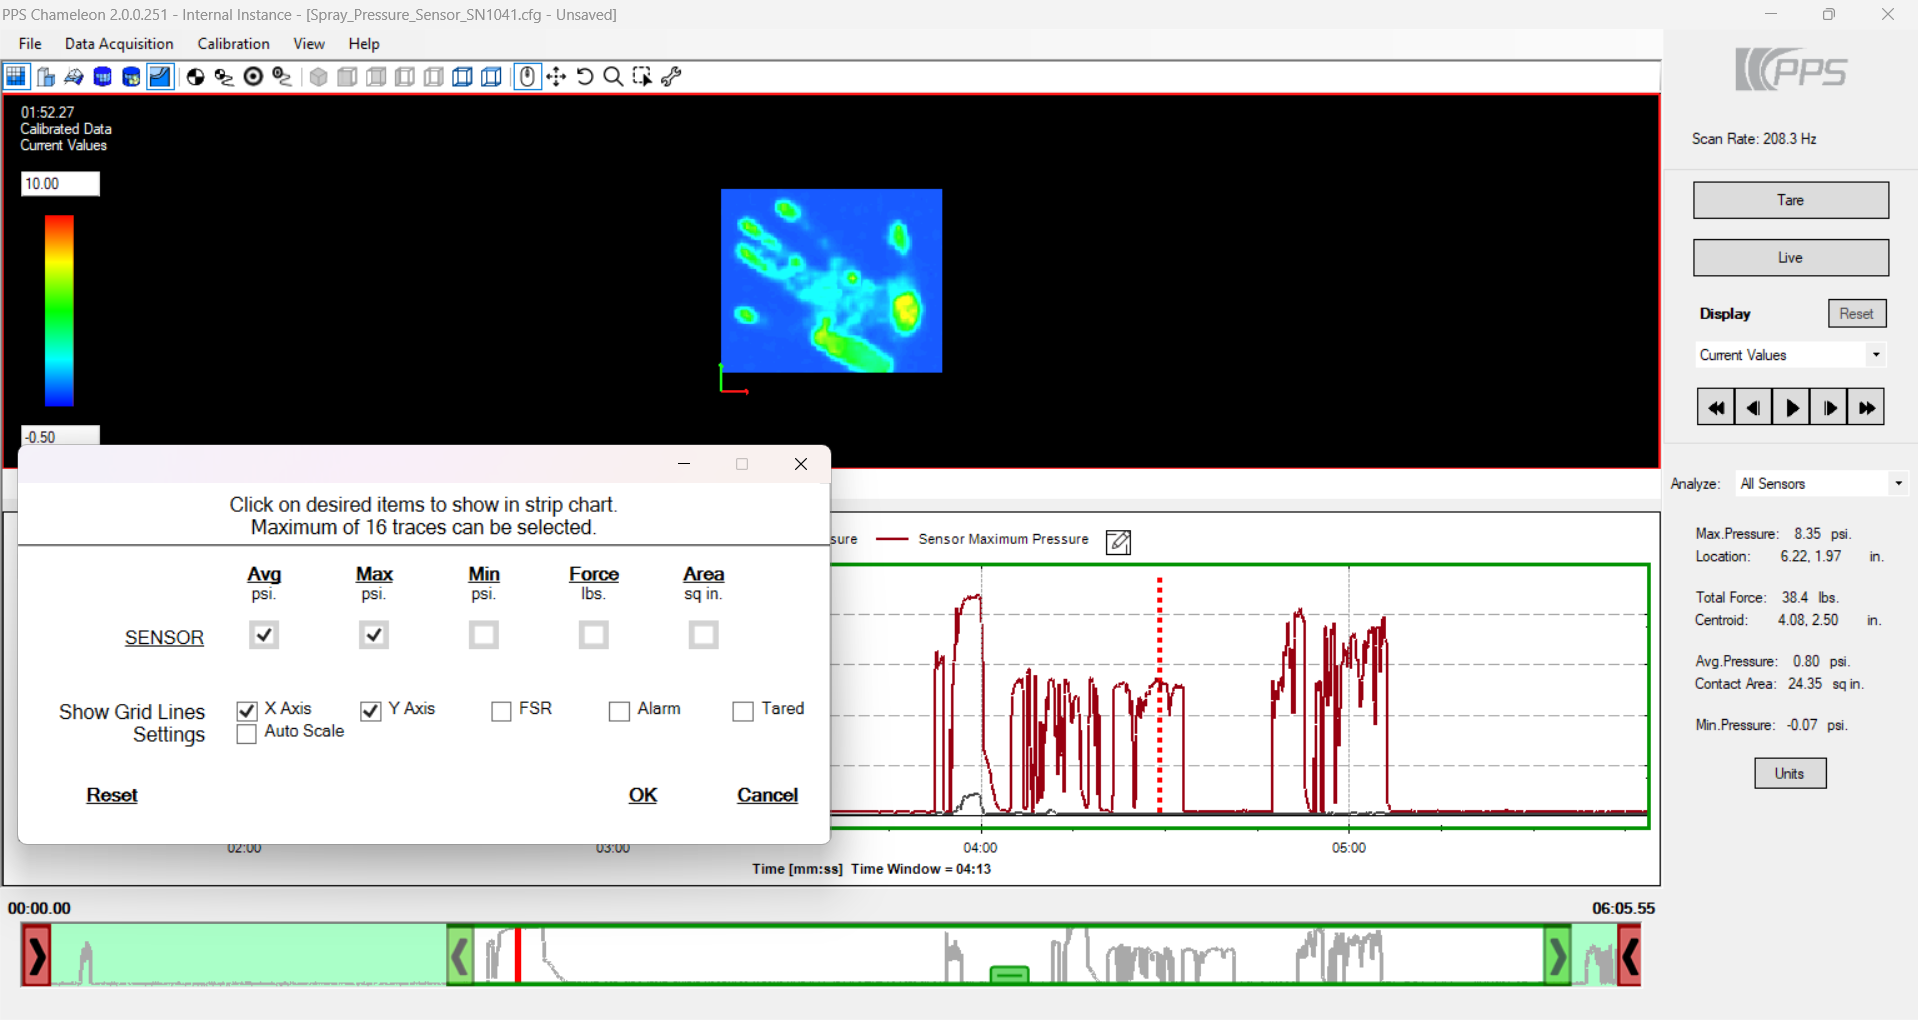
Accurate Physical Units and Smarter Region Control
Whether your tactile system contains only a few sensing elements or a high-density matrix of thousands, Chameleon 2026 delivers a clearer, more accurate representation of sensor performance. Each element is converted into real physical units (e.g., kPa, psi, N, lbf), using your sensor’s calibration file, and displayed according to the true geometry of the array.
You can isolate individual sensors, select key regions of interest, or work with the entire sensor field in 2D or 3D modes. Element selection has been redesigned for smoother operation and now supports quick loading and saving directly within your project files.
The new View Manager allows users to store up to five unique, custom-configured views, including axis settings, colour scaling, 3D camera position and display mode, which makes it easy to return to repeat test conditions or standardised review styles.
Visualisation
Cleaner Rendering and More Intuitive Interaction
The Chameleon 2026 visualisation engine has been rebuilt for a cleaner, more intuitive experience. Interacting with your sensor data is faster, rendering is smoother, and the interface adapts more naturally as you switch between views.
Visual output includes a range of 2D and 3D map styles, giving you different perspectives on how pressure and force change across your system. For high-channel-count sensors, you can quickly toggle between minimum, mean, maximum or total force maps, or visualise contact area and centroid movement.
Improved 3D defaults, including automatic 110% peak scaling and refined mesh height settings, help ensure that the shape and magnitude of pressure distributions are immediately easy to interpret. Camera pre-sets and zoom tools also respond more predictably, allowing deeper analysis without interrupting workflow.
Analysis & Data Export
Stronger Tools for Data Interpretation and Sharing
Chameleon 2026 introduces a stronger set of analysis tools designed to support both simple inspections and advanced data-driven research. You can now copy analysis values directly to the clipboard, making it easier to transfer numerical results into reports, spreadsheets or statistical tools.
Element selections made during analysis are automatically saved and can be reloaded within the same TVR file, streamlining repeated investigations on similar regions or repeated trials.
Exporting has been upgraded with new options including single-frame image export, saving still images directly from time markers, averaged-second export for smoothing data over time windows, and enhanced repair-file editing for long or complex recording sessions. These updates make it easier to share data across platforms such as Excel®, MATLAB®, Python or other third-party analysis environments.
Synchronised Video
Improved Alignment Between Data and Real-World Events
Synchronised video remains one of the most powerful components of Chameleon, bridging the gap between tactile data and real-world behaviour. Chameleon 2026 enhances this capability with a smoother, more stable interface that keeps video tightly aligned with sensor timelines.
Annotation placement and editing are more intuitive, supporting clearer documentation of test events. The updated video window anchors cleanly to the main display area and maintains alignment during playback or scrubbing, while improved double-click handling eliminates the inconsistencies found in earlier versions.
Whether you are validating product behaviour, diagnosing mechanical interactions, or studying ergonomic performance, the upgraded video-sensor synchronisation enables more accurate review and a deeper understanding of what occurred during each moment of data capture.
Chameleon Licensing Overview
Chameleon is designed as a companion to PPS tactile sensor hardware, with functionality closely linked to the presence of a connected sensor. Every PPS system includes Chameleon Core, which provides real-time data streaming, live visualisation, review of captured data, and basic analysis tools such as average, minimum and maximum values for evaluating tactile interactions during testing. Chameleon Core does not require a license file and has no time-based restrictions, allowing unrestricted use whenever a PPS sensor is connected.
For users who need to record experiments and access more advanced analysis capabilities, Chameleon Premium expands the platform with additional tools for measurement, documentation and integration. Premium enables recording and storage of test sessions (TVRs) for later review, advanced data analysis features, export of measurement data for use in external environments, synchronised video integration, and Windows API access for custom software workflows.
Chameleon Premium is available as either a monthly or annual subscription, both providing the same functionality. The Premium license also includes a two-hour advanced data analysis training session, helping teams make effective use of the platform’s extended measurement and interpretation tools.
This structure allows users to begin working immediately with Chameleon Core, and enable recording, advanced analysis and integration capabilities through Chameleon Premium when their workflow requires more advanced experimentation and data handling.
| Feature comparison | Chameleon Core (included with system) |
Chameleon Premium (Monthly or Annual subscription) |
|---|---|---|
| Stream live data | ✔ | ✔ |
| Review mode for captured data | ✔ | ✔ |
| Flat colour map display or strip chart | ✔ | ✔ |
| Load TVR (view previously captured data) | ✔ | ✔ |
| Basic analysis (Ave / Min / Max) | ✔ | ✔ |
| 3D views and tools | ✔ | ✔ |
| Dual display for comparison | ✔ | ✔ |
| Save TVR for future review | — | ✔ |
| Advanced analysis & thresholds | — | ✔ |
| Advanced export (video, CSV) | — | ✔ |
| Video capture (synchronised) | — | ✔ |
| API and examples | — | ✔ |
| Upgrades to new versions | — | ✔ |
| Computer limit | 1 | 1 |
| Basic handover training | ✔ | — |
| Advanced data analysis training (2 hours) | — | ✔ |
Explore Our Tactile Sensors
Tactarray
High-Resolution Pressure Mapping for Research & Design
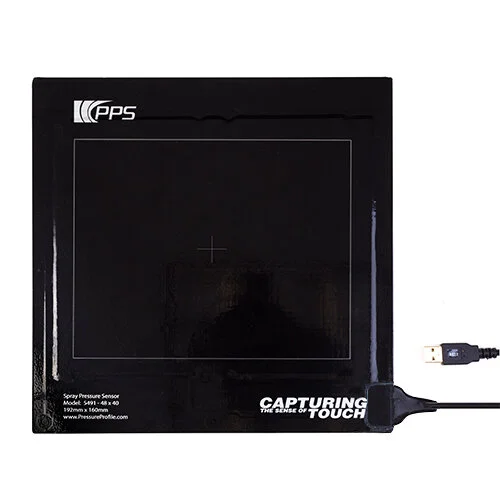
스프레이(Spray)
Quantitative Fine-Mist & Spray Pattern Analysis
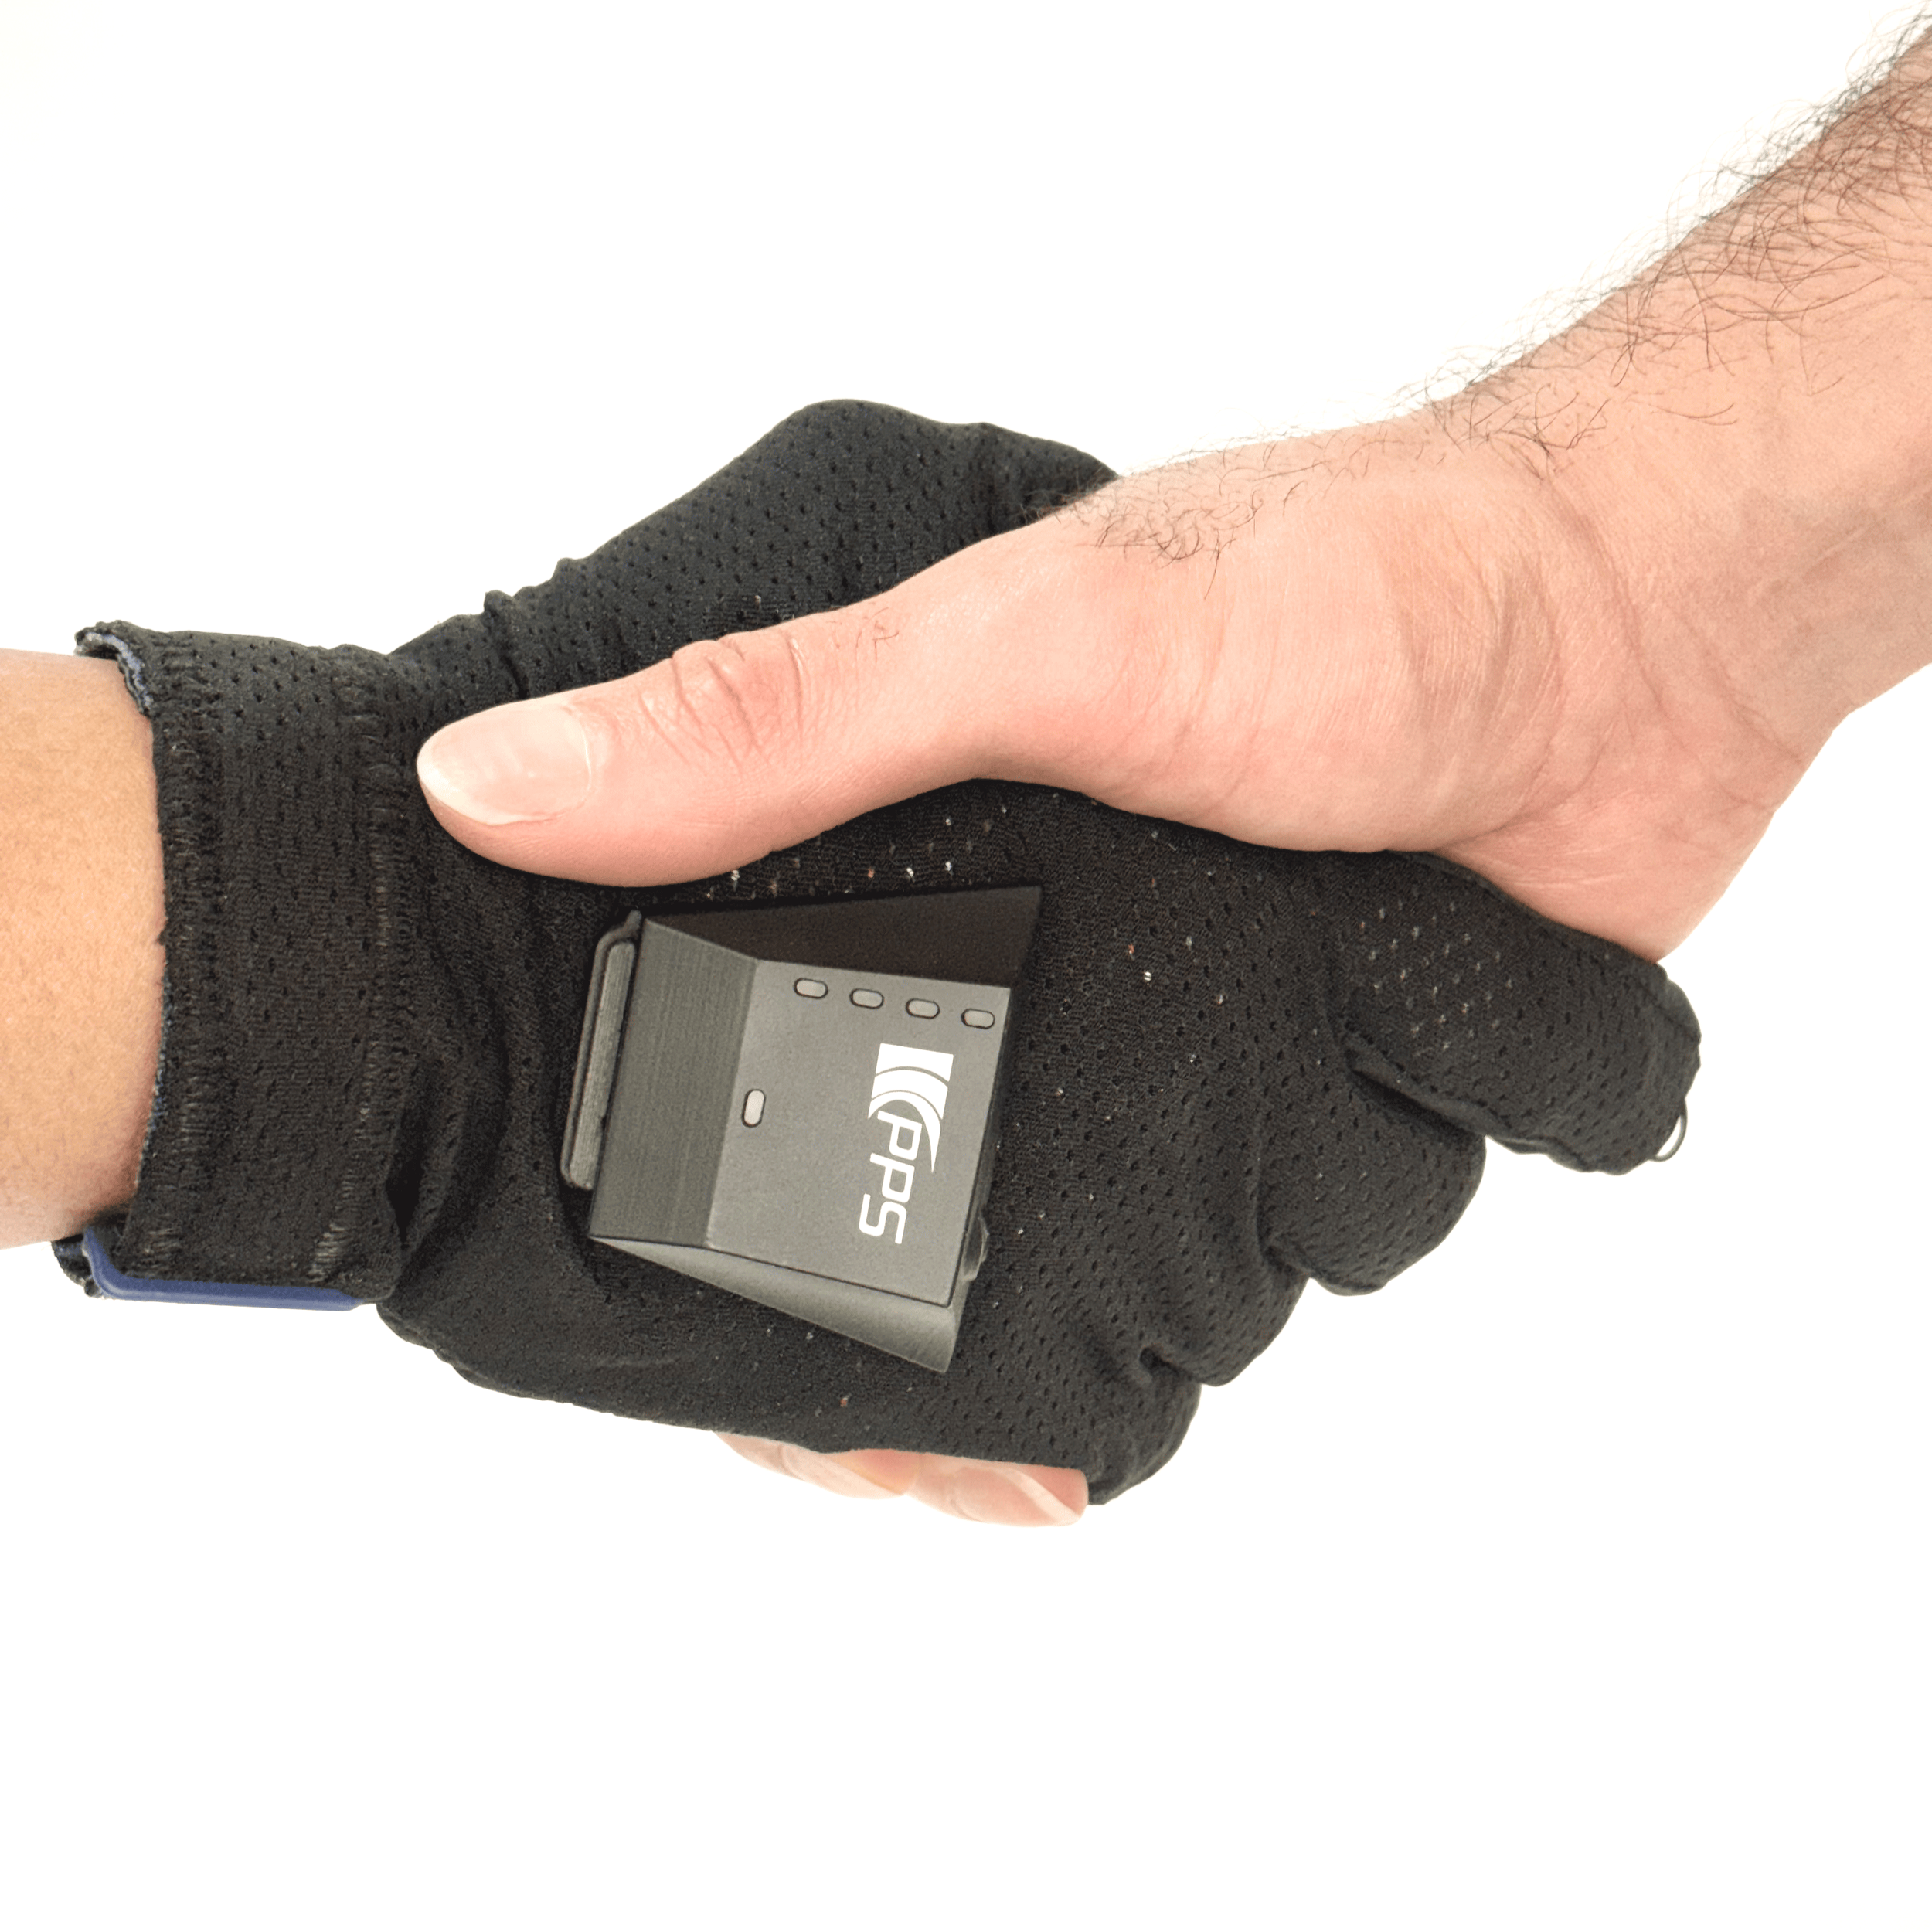
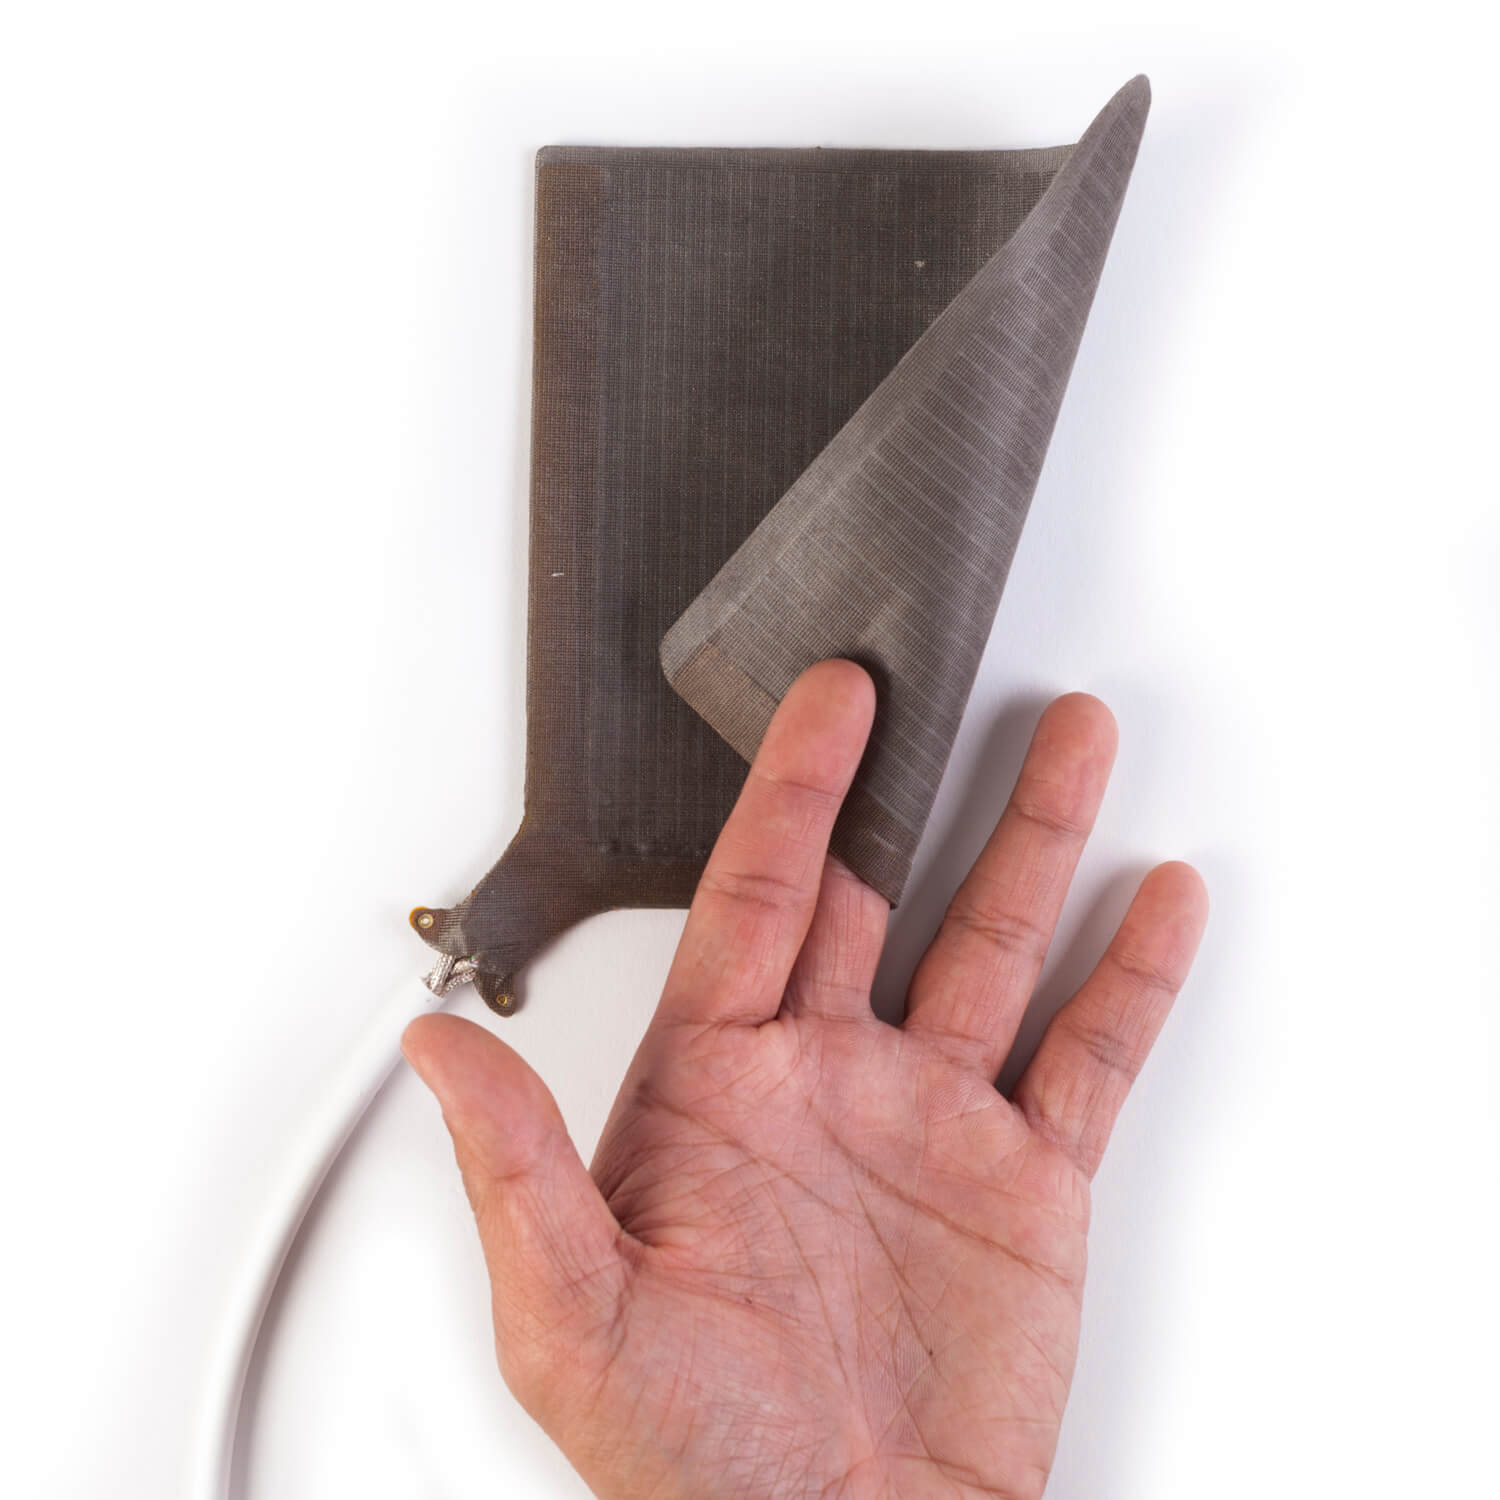
택타일글러브(TactileGlove)
Finger-Level Force and Grip Interaction Measurement
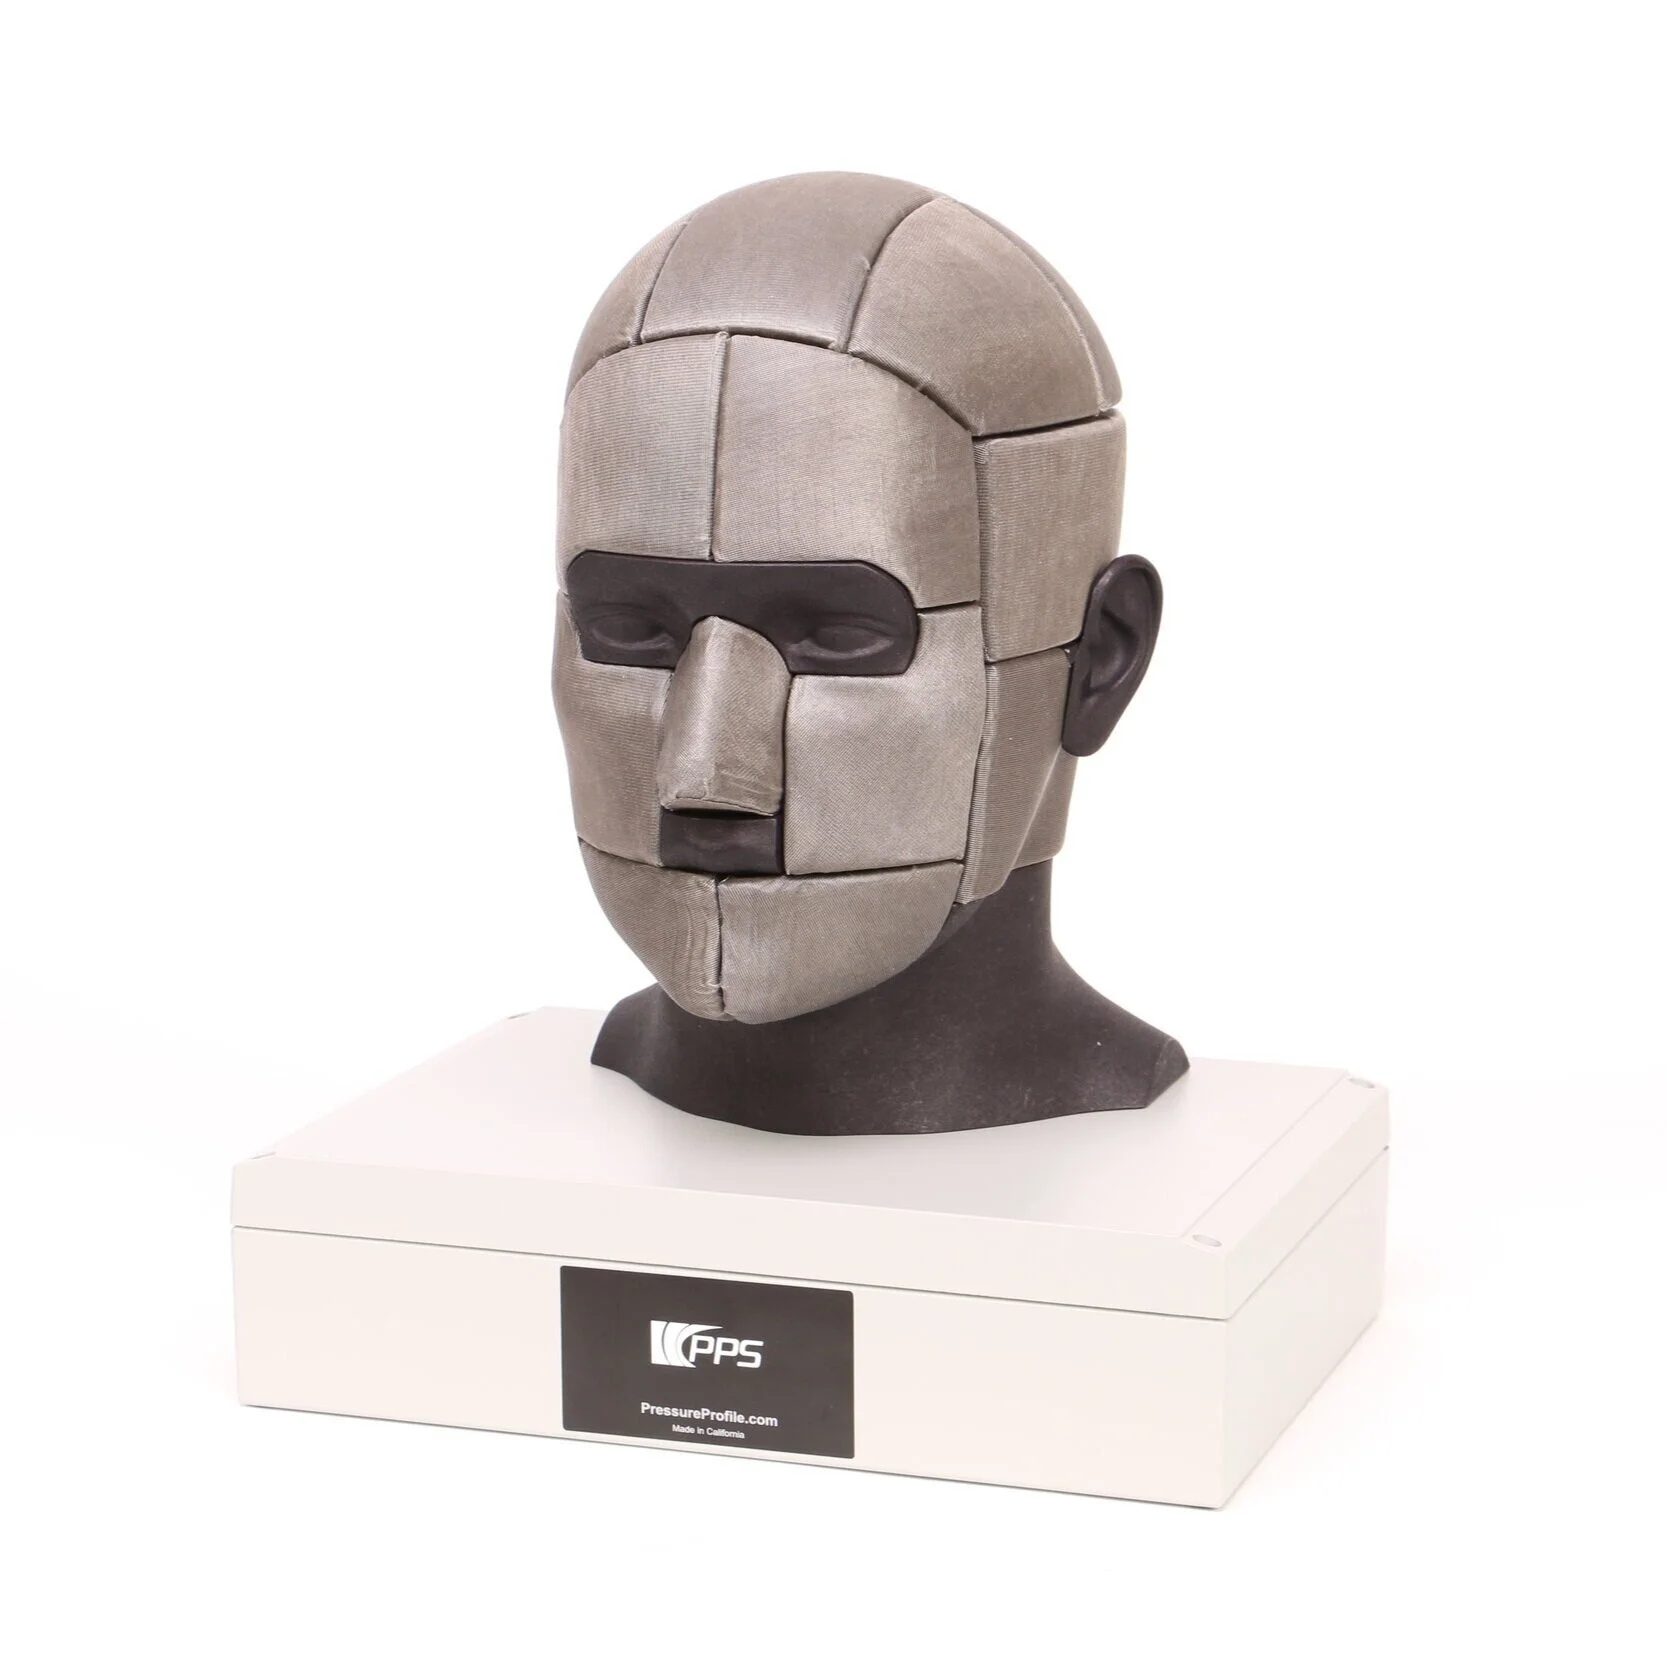
택타일헤드 (TactileHead)
3D Surface Pressure Insight for Fit, Comfort & Contact